
Trendr
Engineering case study · Testing crypto price-direction signals under temporal validation
Trendr asks whether price and volume history carries enough signal to classify the next day's direction once the evaluation is done honestly. The answer, on the saved results, is mostly no. Building something that could establish that, and then reporting it rather than hunting for a friendlier number, is the point.
- Language
- Python
- Domain
- Financial ML
- Assets
- BTC, ETH, SOL
- Features
- 27 from daily OHLCV
- Tests
- 56 Pytest cases
The question
Is there a signal, and does it survive contact with reality?
Predicting tomorrow's direction is an easy problem to appear to solve. Train on everything, report accuracy, show a rising equity curve. The result usually says more about how it was measured than about the market.
The version worth answering has four parts:
- Do price and volume features identify a next-day directional signal at all?
- Does that signal hold on data the model has never seen?
- Is anything left after transaction costs?
- Is it stable across assets and across market periods, or does it appear in one and vanish in the next?
Engineering brief
- Architecture
- A Python package with a Typer CLI: ingestion and sanitisation, a 27-feature time-series pipeline, LightGBM and scikit-learn models, and a cost-aware backtester. Models and metrics are written to disk so the Streamlit app reads saved artifacts.
- The hard part
- Making the evaluation honest. A random split leaks future rows into training and produces an accuracy figure that means nothing, so everything is ordered by date: chronological train, validation and test, plus expanding-window walk-forward folds.
- Testing
- 56 Pytest cases across feature correctness, backtest mathematics and model integration. The look-ahead audits perturb future values, rebuild the features, and assert earlier rows did not change, so leakage is caught by the suite rather than by a suspiciously good result.
- Known limitation
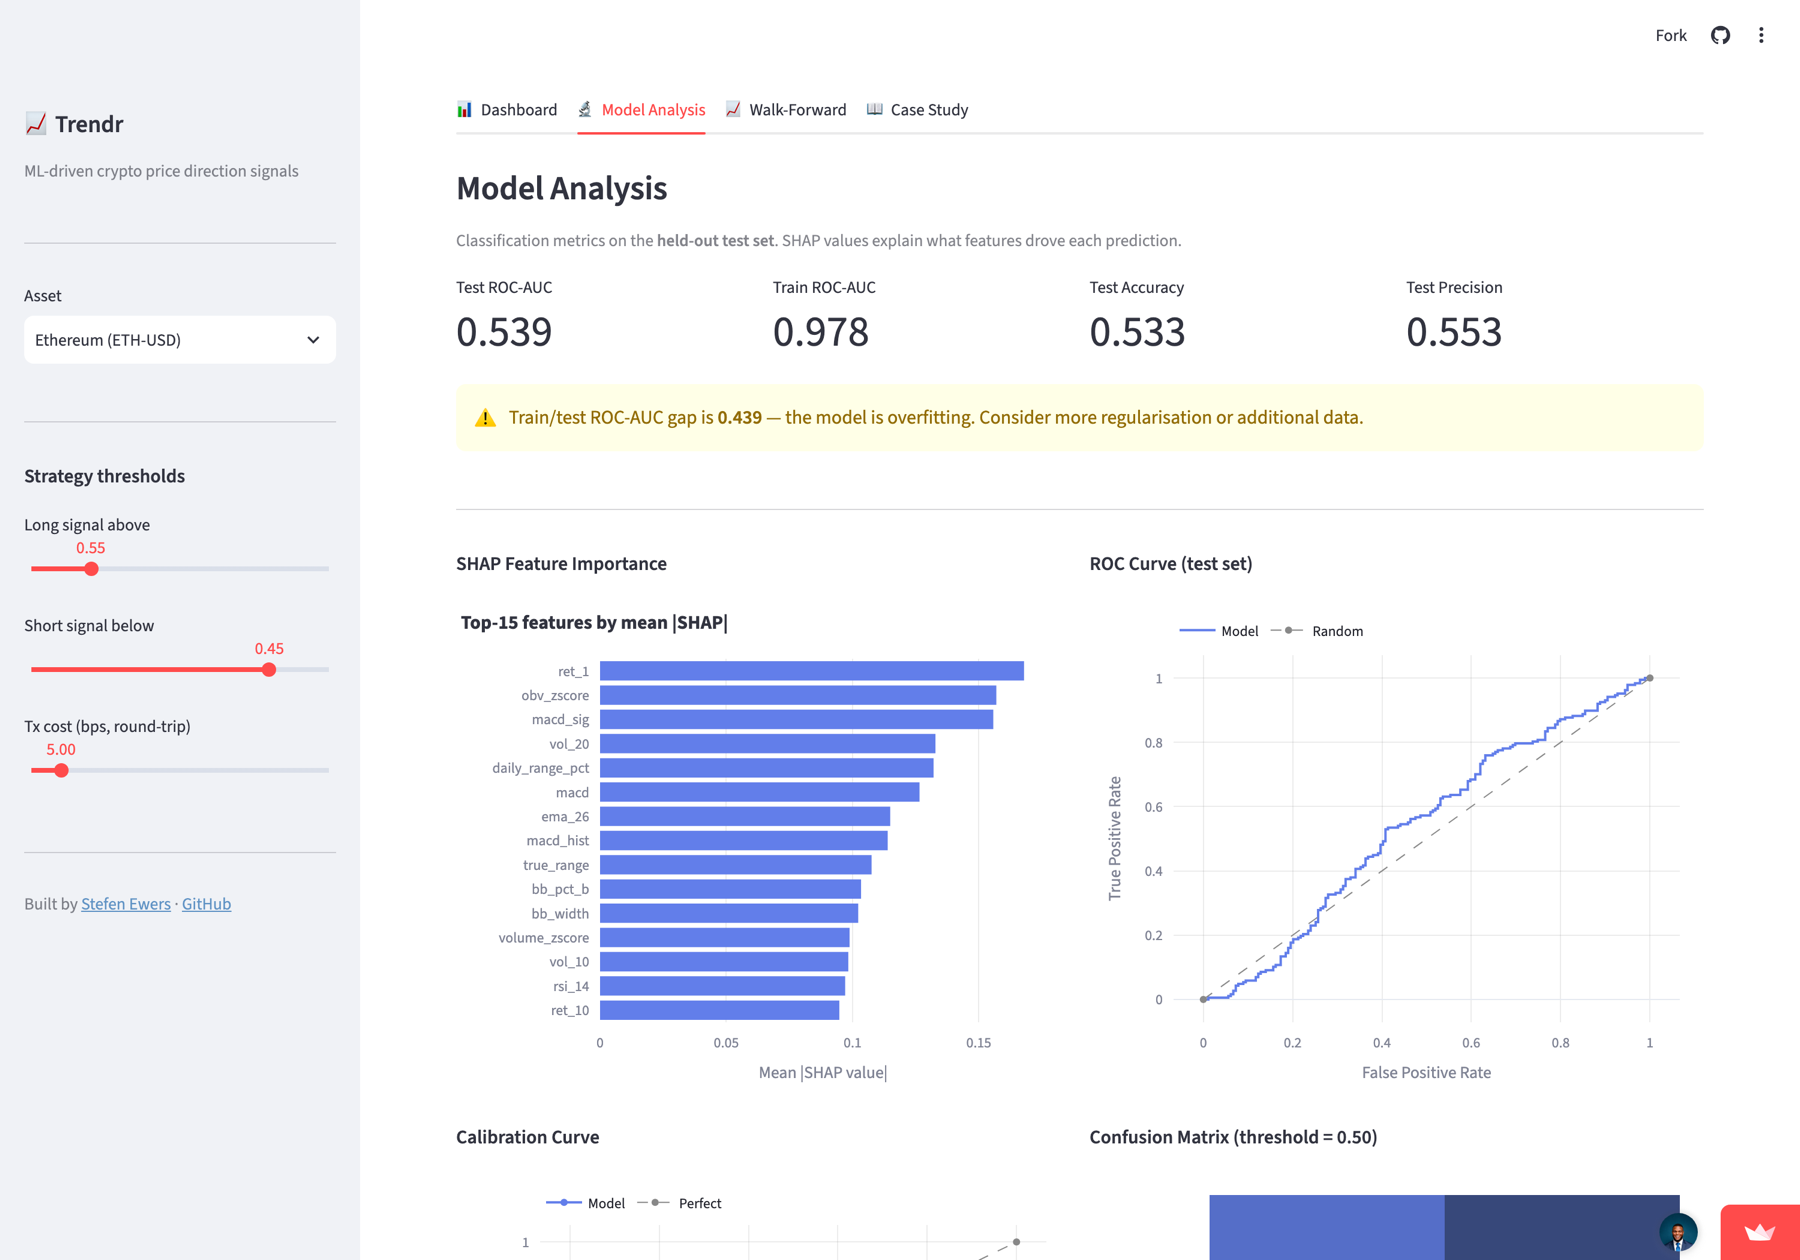
- The saved out-of-sample results are close to random: ROC-AUC 0.506 to 0.539 against training scores near 0.98. Three assets chosen after the fact, one flat cost assumption, and daily bars that hide intraday structure.
Evaluation design
Why the split matters more than the model
A random train/test split is wrong for time series. Shuffling puts next week's rows in the training set and last week's in the test set, so the model is scored on a period it has effectively already seen. Accuracy climbs and means nothing.
Trendr splits strictly by date instead. The most recent year is held out and touched once. The year before it tunes the signal thresholds. Everything earlier trains the model.
Everything before the last two years
The preceding 365 days
The most recent 365 days
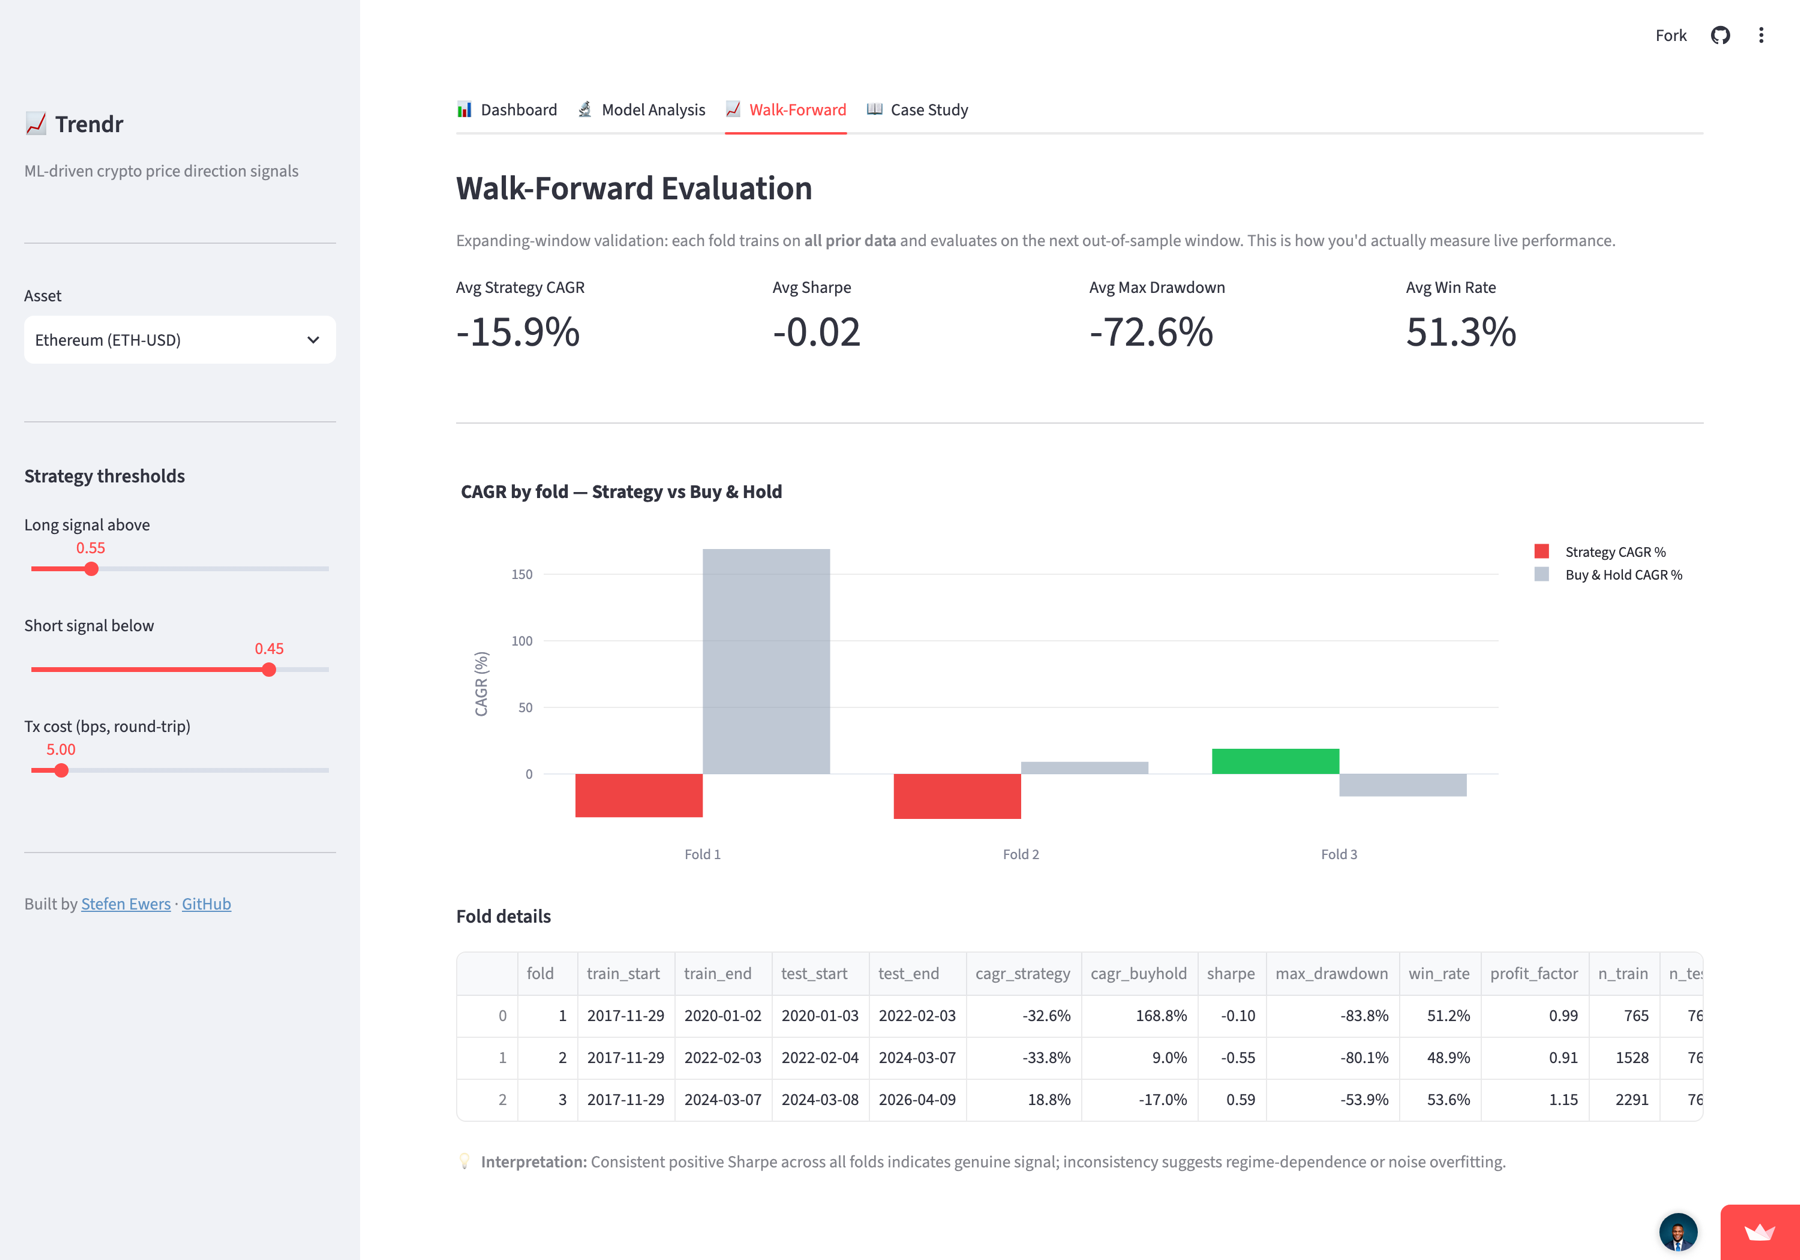
Model selection inside the training window uses time-series cross-validation rather than k-fold, for the same reason. On top of that sits expanding-window walk-forward evaluation. Each fold trains on all prior data and is scored on the window after it, which is as close as offline testing gets to running it live. The library defaults to five folds; the hosted app runs three to stay inside its memory budget.
None of this is self-reported. The test suite includes look-ahead audits that perturb future values, rebuild the features, and assert the earlier rows did not change. If information leaks backward, those tests fail.
Data and features
27 features from daily OHLCV
Daily bars for BTC, ETH and SOL come from yfinance. Every feature at row t uses only information available at that day's close, and the target is whether the next day closes higher.
The families are deliberately different from one another. Testing several kinds of information at once is how you find out which kind, if any, carries signal, rather than assuming momentum or volume is the answer in advance.
Models
A gradient-boosted tree, and two things to measure it against
LightGBM is the primary classifier. The feature set is tabular, mixed in scale, and full of non-linear interactions, which is where boosted trees do well. They need no scaling, so features enter the model in their own units and SHAP can be read directly against them.
A scikit-learn GradientBoostingClassifier runs as a second implementation of the same idea, and a dummy classifier provides the floor. That baseline is the important one. On a near-balanced target, a model that has learned nothing still scores near 50%, so any headline accuracy has to be read against the dummy rather than against zero.
Signals
From probability to position
A probability is not a decision. Trendr converts one into three states: long above 0.55, short below 0.45, flat in between. The gap in the middle is deliberate. A prediction of 0.52 is not a view, and trading it would pay costs for noise.
The backtest charges five basis points round-trip on every position change, and enters on the following bar. A signal computed from today's close cannot be traded at today's close, and a backtest that pretends otherwise is measuring time travel. That behaviour is covered by a test.
Results
Close to random, and honest about it
These are the saved values from the model artifacts, one row per asset, scored once on the held-out year.
| Asset | Test ROC-AUC | Test accuracy | Train ROC-AUC |
|---|---|---|---|
| Bitcoin | 0.506 | 0.508 | 0.977 |
| Ethereum | 0.539 | 0.533 | 0.978 |
| Solana | 0.521 | 0.546 | 0.991 |
A ROC-AUC of 0.50 is a coin flip. Bitcoin lands at 0.506. Ethereum, the best of the three, reaches 0.539. Read against the training scores in the last column, the shape of the problem is obvious: the model fits the past almost perfectly and carries close to none of it forward. That gap of roughly 0.44 is not a tuning problem to be optimised away. It is what overfitting looks like when the underlying signal is weak.
The app states this itself rather than burying it. When the train/test gap crosses a threshold it prints an overfitting warning above the charts, and the walk-forward tab reports a negative average Sharpe with folds that disagree in direction. A single flattering backtest window exists in the saved reports, and it would have been the easiest number on this page to lead with. It is not here, because a near-random classifier producing one good year is a description of that year.
Interface
Making the analysis inspectable
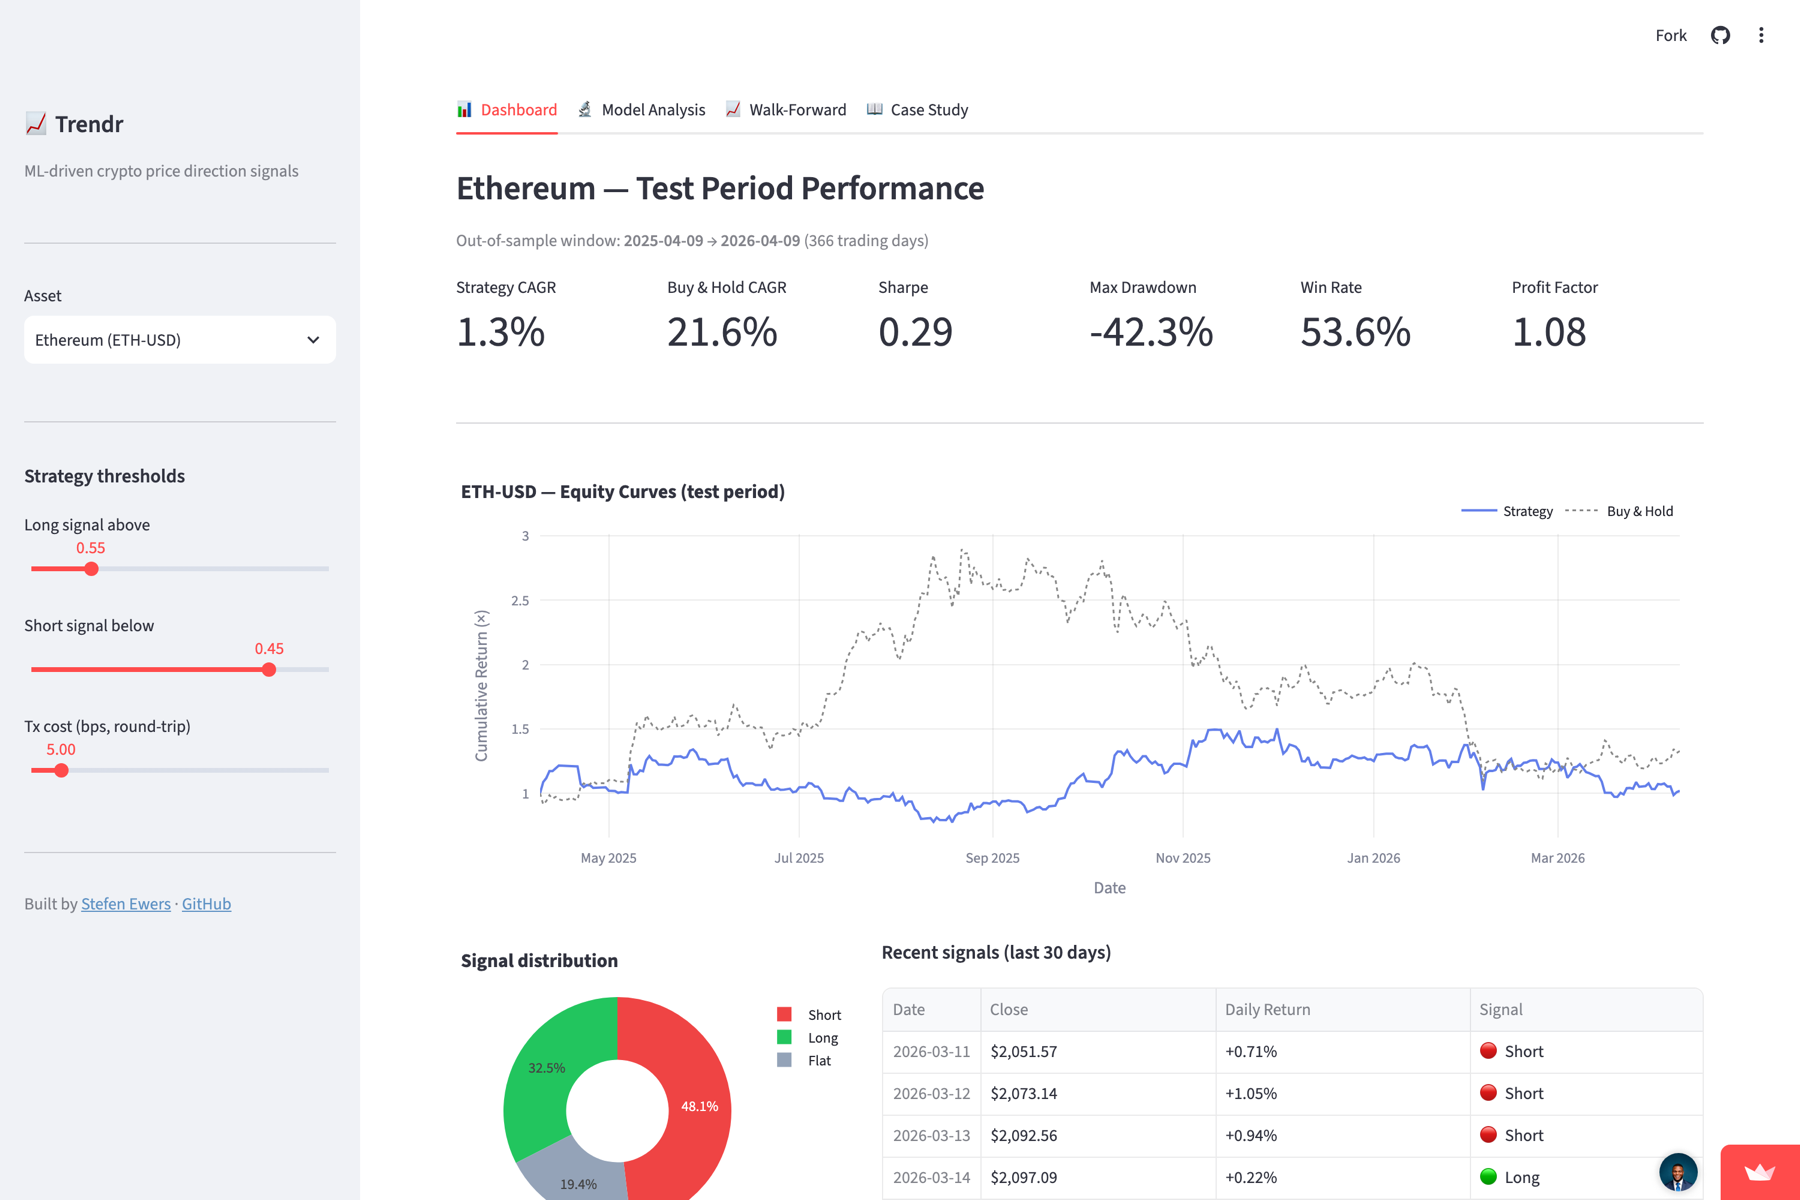
A notebook with these results convinces nobody, because a reader cannot poke at it. The Streamlit app exists so the analysis can be interrogated rather than taken on trust, which matters more when the finding is negative.
SHAP answers what the model is actually keying on. The ROC curve shows the separation visually, which is harder to overstate than a single number. Calibration asks whether a stated 0.6 behaves like 0.6, since the thresholds depend on that being true. The threshold and cost sliders let a reader move the assumptions and watch the result move, which is the fastest way to see how fragile it is.
Limits
What this does not establish
Markets are not stationary
A relationship that held through one regime can vanish in the next. The walk-forward folds disagree with each other, which is the honest reading of that.
Daily bars hide market structure
Everything intraday is invisible at this resolution: order flow, liquidity, where inside the day the move happened.
Three assets, chosen after the fact
BTC, ETH and SOL are survivors. Assets that failed in the same period are not in the sample, which flatters any result drawn from it.
One flat transaction-cost number
Five basis points round-trip stands in for spread, slippage and fees, none of which are constant, and none of which are kind during the moves a directional model most wants to catch.
A single primary model
LightGBM with a small grid search. Comparing more model families would say more about whether the ceiling is the model or the data.
Backtests are not forecasts
Every number here is a description of the past. None of it establishes future returns.
Next
What I would test next
- Paper trading first, over a period nobody has looked at yet, before any capital is involved.
- Feature-drift monitoring, since the failure mode is a relationship decaying quietly rather than breaking loudly.
- Longer horizons. One day may simply be below the noise floor; a five or ten day direction is a different question.
- Cross-asset and on-chain inputs, which is information the price series does not contain.
- Position sizing that scales with model confidence rather than treating every signal as equal.
- Stronger baselines and ablations: how much of this is momentum alone, and which feature families earn their place?
How it is built
Implementation
Python throughout. pandas and NumPy for the feature pipeline, scikit-learn for the pipeline and grid search, LightGBM for the classifier, SHAP for attribution, yfinance for data, Plotly for the charts, joblib for serialised models, Streamlit for the interface.
The package ships a Typer command-line workflow for download, training and backtesting, which writes models and metrics to disk so the app reads saved artifacts rather than retraining on every page load. 56 pytest cases cover feature correctness, backtest mathematics, model integration and the look-ahead audits.
Research code on public market data, not investment advice. The hosted demo may need a moment to wake.