
Meridian
Engineering case study · Testing fleet operations before launch
Role: simulation architecture, the forecasting and dispatch models, the FastAPI service, and the TypeScript frontend.
A simulation and experimentation platform for fleet, charging, dispatch, and market-expansion decisions.
- Service
- Python · FastAPI · Pydantic
- Models
- LightGBM · SimPy · OR-Tools
- Frontend
- Next.js · TypeScript
- Tests
- 25 Pytest cases
- Status
- Runs locally, not hosted
Meridian is a fictional product. It is not affiliated with, derived from, or representative of any real ride-hail operator, and it uses no proprietary data. Every figure below is simulated output from synthetic demand.
Engineering brief
- Architecture
- A monorepo: a Python FastAPI service running the simulation, and a Next.js TypeScript frontend. A LightGBM quantile model forecasts demand, scenario generation samples nights from the fitted spread, a SimPy model runs the night, and an OR-Tools solver assigns vehicles. Pydantic models are mirrored as TypeScript types.
- The hard part
- Making a run reproducible. A run is determined by its config and seed and carries an input snapshot with policy, model and engine versions, so a result someone disputes can be replayed exactly, including on another machine.
- Testing
- 25 Pytest cases across config, demand, dispatch, runner behaviour and reproducibility. The reproducibility test caught a real bug. The served zones were stored in a Python set, and per-process hash randomisation fed them to the sampler in a different order. Identical seeds diverged across machines while the rest of the suite stayed green.
- Known limitation
- No routing engine: distance is straight-line times a circuity factor at one average speed, which is the largest single source of error. Demand is synthetic, there is no significance testing on the difference between arms, and nothing is calibrated against a change that actually shipped.
The problem
“It depends on the night” is a real answer, and a useless one
An operations team wants to expand a service area, prioritise airport pickups, or change how vehicles are dispatched. Someone asks what it will cost. The honest answer is that it depends on demand, on how much charging capacity is free that evening, and on where the fleet happens to be sitting when the demand arrives.
A spreadsheet becomes brittle once demand, vehicle state, charging queues, and dispatch policy interact over time. So these decisions get made on intuition and a partial rollout. The change looks fine for a week. Then a busy Friday exposes a constraint nobody was watching, usually somewhere other than where the change was made.
Meridian exists to move that discovery earlier. It runs the change against many sampled nights, reports the spread rather than a point estimate, and returns a decision with the reasoning and the guardrails attached.
Users and jobs
Three teams, one artifact
The hard part is that three groups need this tool and each wants something different from the same run. Serve only one of them and the other two ignore it.
Operations
Decide whether a policy or service-area change is safe to roll out, and know what to watch if it goes to pilot.
Data science
Check that the forecast underneath a recommendation is calibrated, and that its uncertainty reached the answer.
Engineering
Understand what a policy change actually requires, and reproduce a result that looks wrong.
So one run output answers all three. Operations gets the verdict and guardrails on top. Data science gets the calibration and spread in the middle. Engineering gets a reproducible snapshot at the bottom.
Design decisions
What the system refuses to do
The recommendation is a rule, not a model
A learned recommender would be less useful here, because the disagreement is almost never about the arithmetic. It is about the target. An operator has to be able to read why a change was called, disagree with a threshold, edit it in the config, and re-run. Making the verdict a transparent rule over the experiment’s own targets keeps that argument possible.
“Pilot” is the verdict that earns its keep
A binary launch-or-reject is too crude for this decision. A change that moves the primary metric a long way but falls short of its goal is a pilot candidate. The goal may be wrong, or the gap may close with more capacity instead of a new policy. What earns a rejection is a change that does not meaningfully move the metric it was designed to move.
No metric is a bare point estimate
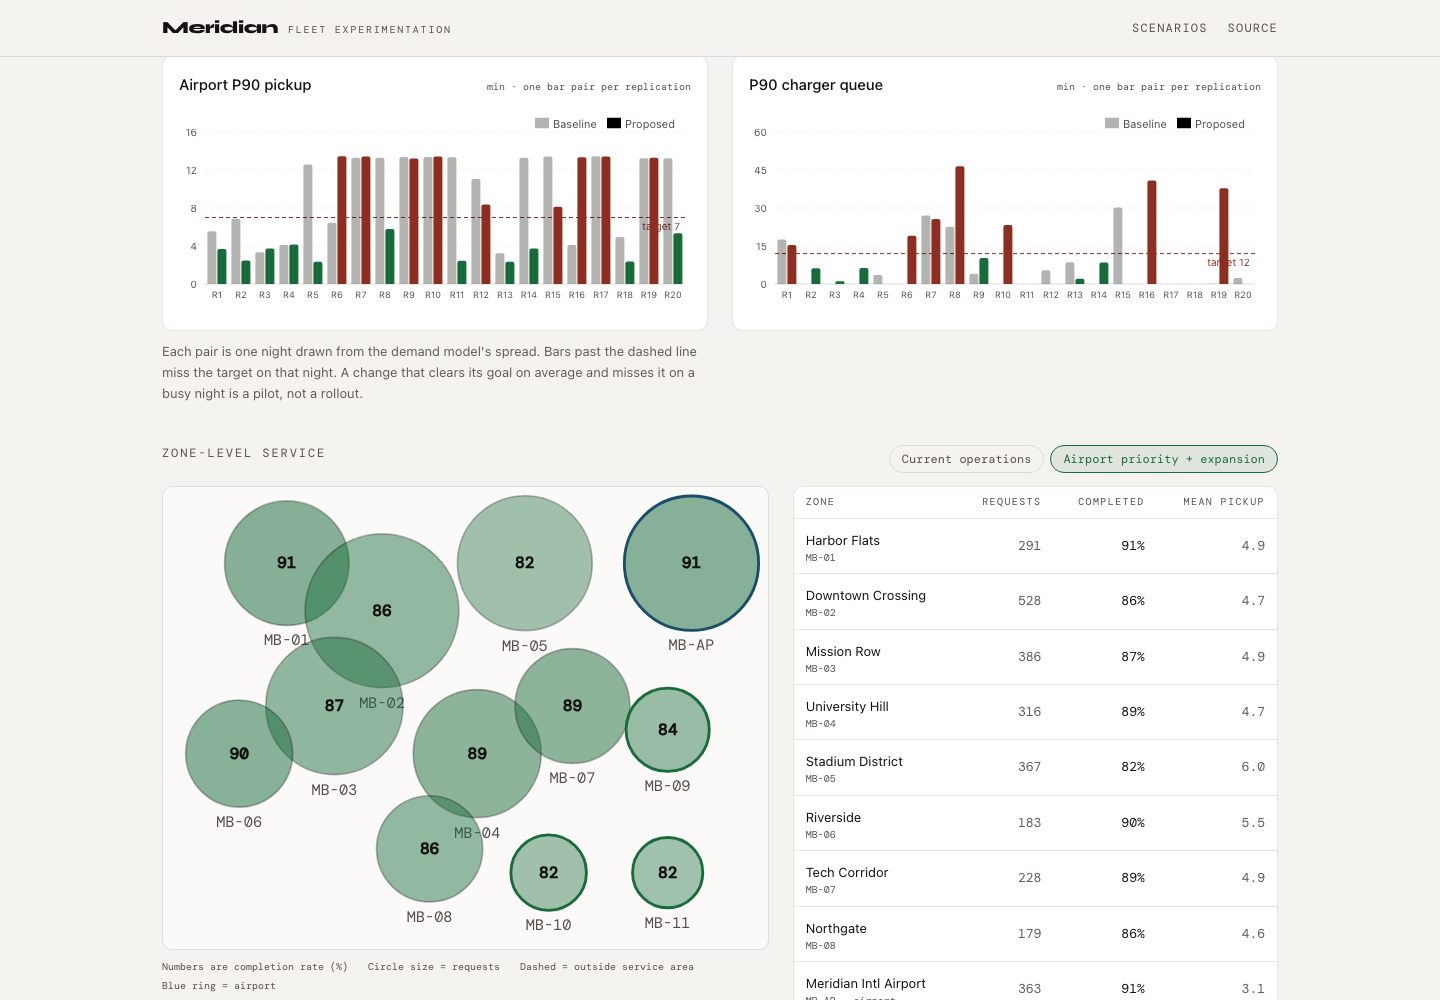
Every figure in the product is a mean with a P10–P90 band, and the uncertainty chart plots one bar pair per simulated night. The central finding in the flagship experiment depends on it: the proposed change clears its target on a typical night and breaches a guardrail on a busy one. A table of means would have hidden that.
Both arms see the same night
Each replication samples demand once and runs baseline and proposed against that identical draw. Pairing removes weather from the comparison, so any difference between the arms is policy. It also buys far more signal per second of compute than simply running more independent nights.
Zones are a schematic, not a map
The service area is invented, so drawing it over real cartography would imply a real market. Circles sized by demand and filled by completion rate show which parts of the network a change helps and which it strains, which a choropleth of a real city would obscure.
Experiments are files, not database rows
An experiment definition is a YAML file that moves through pull request review like the code it tests. That is also what makes a config version and an input snapshot mean something: a result is tied to a definition someone approved.
System architecture
Forecast, sample, simulate, decide
A LightGBM quantile model learns P10, P50, and P90 demand for every zone and every fifteen-minute interval. Those quantiles feed the simulation directly: each night's arrivals are drawn from the fitted spread. A zone with an uncertain forecast swings more than a zone with a tight one, so the uncertainty reaches the recommendation.
A SimPy model then runs the night. Vehicles are processes, chargers are a resource with real capacity so queueing emerges from contention rather than assumption, and riders leave if nobody arrives. Two dispatch policies compete on identical demand: greedy nearest-available, and a batched min-cost assignment solved with OR-Tools that encodes airport priority and a battery reserve as cost rather than as hard rules. Whether the optimisation earns its complexity is the question, so both are first-class.
A run is determined by its configuration and seed, and carries an input snapshot, policy version, model version, and engine version. Re-running reproduces the numbers exactly, including on another machine.
experiments/*.yaml  ──▶  FastAPI  ──▶  per replication:
(versioned config)                        sample_scenario   ← P10/P50/P90 spread
                                          FleetSim (SimPy)  ← vehicles, chargers, riders
                                            └ dispatch      ← greedy | OR-Tools
                                          aggregate → bands
                                          recommend → verdict
                                              │
Next.js UI  ◀───────────────────────────────  ┘
library · workspace · results
Building it surfaced more design errors than writing it. Dispatch was assigning vehicles twenty-two minutes away to riders with eleven minutes of patience, so both arms threw away trips for no reason. The optimiser went infeasible whenever pending requests outnumbered idle vehicles and quietly fell back to greedy, which meant the optimised arm was running the baseline during exactly the busy periods it existed for. Repositioning aimed one interval ahead while crossing the metro took longer than one interval, so vehicles arrived after the demand they were sent for.
The one worth keeping was reproducibility. The set of served zones was a Python set, and CPython randomises string hashing per process, so iterating it fed a different order into the destination draw on every run. Identical configs with identical seeds diverged between machines while passing every test, because an in-process repeat cannot catch it. The fix is small. Finding it required not trusting a green suite.
The flagship experiment
Late-night airport expansion
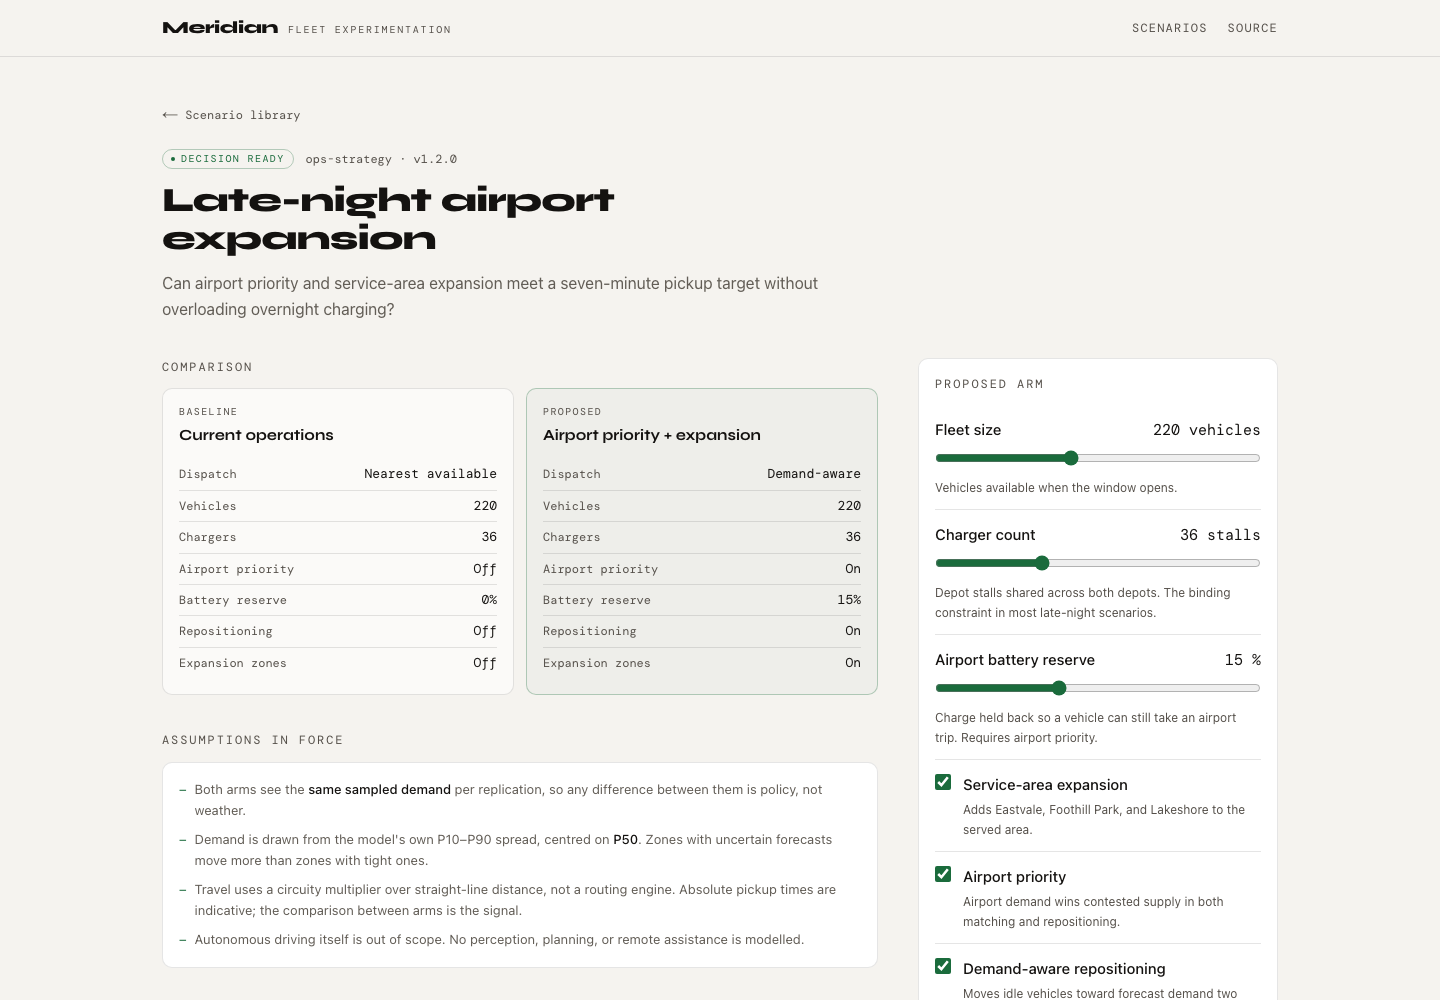
Can airport priority and service-area expansion meet a seven-minute pickup target without overloading overnight charging?
The baseline is current operations: 220 vehicles, two depots, thirty-six chargers, nearest-available dispatch, existing service area. The proposed arm keeps the same fleet and adds an airport-priority queue, a fifteen percent battery reserve for airport trips, demand-aware repositioning, and three new zones.
| Metric | Baseline | Proposed | Change |
|---|---|---|---|
| Airport P90 pickup, curbside | 9.8 min | 7.4 min | −24% |
| Trip completion rate | 90.8% | 87.2% | −3.6 pts |
| Completed trips | 2,578 | 2,618 | +41 |
| Deadhead share of miles | 26.8% | 31.6% | +4.8 pts |
| P90 charger queue | 6.1 min | 12.1 min | +99% |
| Cost per completed trip | $3.61 | $3.74 | +3.4% |
Results and tradeoffs
Pilot recommended, and the reason is not dispatch
Airport pickup improves substantially and the fleet completes more trips overall. But expansion adds demand faster than the policy absorbs it. Trip completion rate drops three and a half points and deadhead rises by nearly five. Under upper-tail demand, the charger queue roughly doubles and breaches the twelve-minute guardrail.
The useful part is where the constraint turned out to live. The experiment was designed as a dispatch question, and dispatch is not what limits it. More vehicles finish a busier night needing charge at the same time, and thirty-six stalls cannot absorb that. A fleet-wide launch would have found this on a Friday.
So the recommendation is a staged pilot on the airport zone and two expansion zones, with charger headroom monitored nightly and depot capacity added before the full service area follows. The product also declines to overclaim: the proposed arm closes most of the gap to the seven-minute target without reaching it, and the summary says so rather than moving the goalposts.
- Demand is synthetic
- The model is trained on generated history, so its holdout metrics measure whether it learned its own generator, not whether it would forecast a real market. Everything downstream treats the model as a versioned artifact, so swapping in a real trip feed is a substitution rather than a rewrite.
- There is no routing engine
- Distance is straight-line times a circuity factor at a single average speed. Absolute pickup times are indicative; the comparison between two arms under identical geography is the result. This is the largest single source of error in the numbers.
- No significance testing yet
- With twenty replications, a small difference between arms is not distinguishable from noise, and the product does not currently say so. It is the most important missing piece of statistical rigour, and it is first on the roadmap for that reason.
- Unit economics are illustrative
- Cost per completed trip uses assumed vehicle-hour, per-mile, and charging figures. The direction of the change is meaningful; the level is arbitrary and labelled as such in the product.
- Uncalibrated against reality
- No backtest against a known past change exists, so Meridian is directionally useful and quantitatively unvalidated. The documentation says that in those words rather than leaving it implied.
Production roadmap
What I would build next
Ordered by what would hurt first if this had to support real decisions rather than demonstrate how they could be supported.
- 01
Real demand, on a schedule
Replace generated history with a trip feed and retrain on a cadence, with drift monitoring. The model is already a versioned artifact with its coverage reported in every run, so this slots in without touching the simulation.
- 02
Confidence on the difference, not the outcome
Report intervals on the delta between arms, add power analysis to size replication counts, and stop sweeps early once the answer is settled. This is what turns “looks better” into “is better”.
- 03
A job queue
Runs move to a worker pool with persisted status and object-storage output, so a two-hundred-replication sweep is not an HTTP request. Run history stops being process memory.
- 04
Routing and time-of-day speeds
A real routing engine removes the biggest approximation in the model and makes absolute pickup times defensible rather than indicative.
- 05
Calibration against a known change
Backtest a change that already shipped and check the simulation’s predicted direction and magnitude. Until that exists, the tool supports decisions but cannot claim accuracy.
- 06
Charging fidelity
Charge curves rather than a linear rate, per-stall power limits, and depot electrical constraints. The flagship experiment is charging-bound, so this is where the answer is most sensitive to the model being wrong.
Not deployed as a hosted demo. It runs locally in two commands, and the README covers setup and a walkthrough.